GOPlot

GOPlot
is an option to decide, if a graphical output is provided.

DetailsDetails

ExamplesExamplesopen allclose all

Basic Examples  (4)Basic Examples  (4)

First load the package:

In[1]:=
Click for copyable input

GTAdjacencyMatrix

Choose the corresponding structure from the structure data file and modify it accordingly.
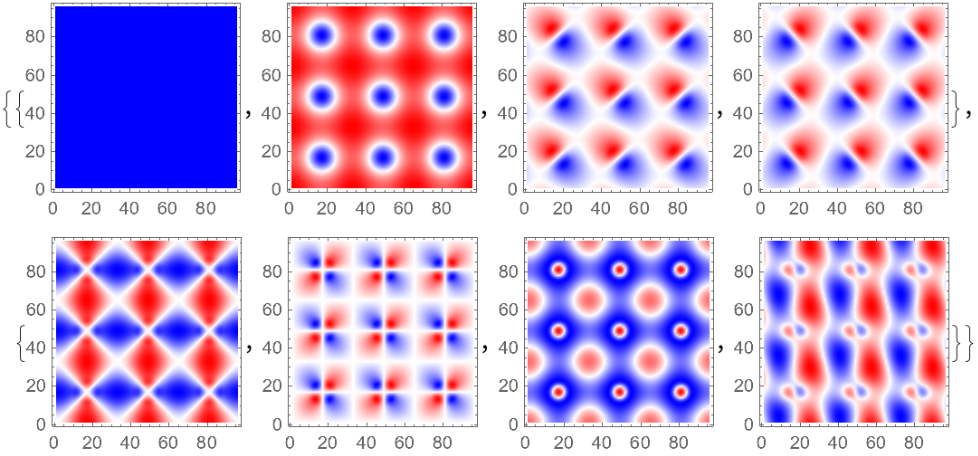
In[2]:=
Click for copyable input
Out[2]=
In[3]:=
Click for copyable input
In[4]:=
Click for copyable input
Out[4]=

GTPhMPBFields

In[1]:=
Click for copyable input

The field can also be plotted directly.
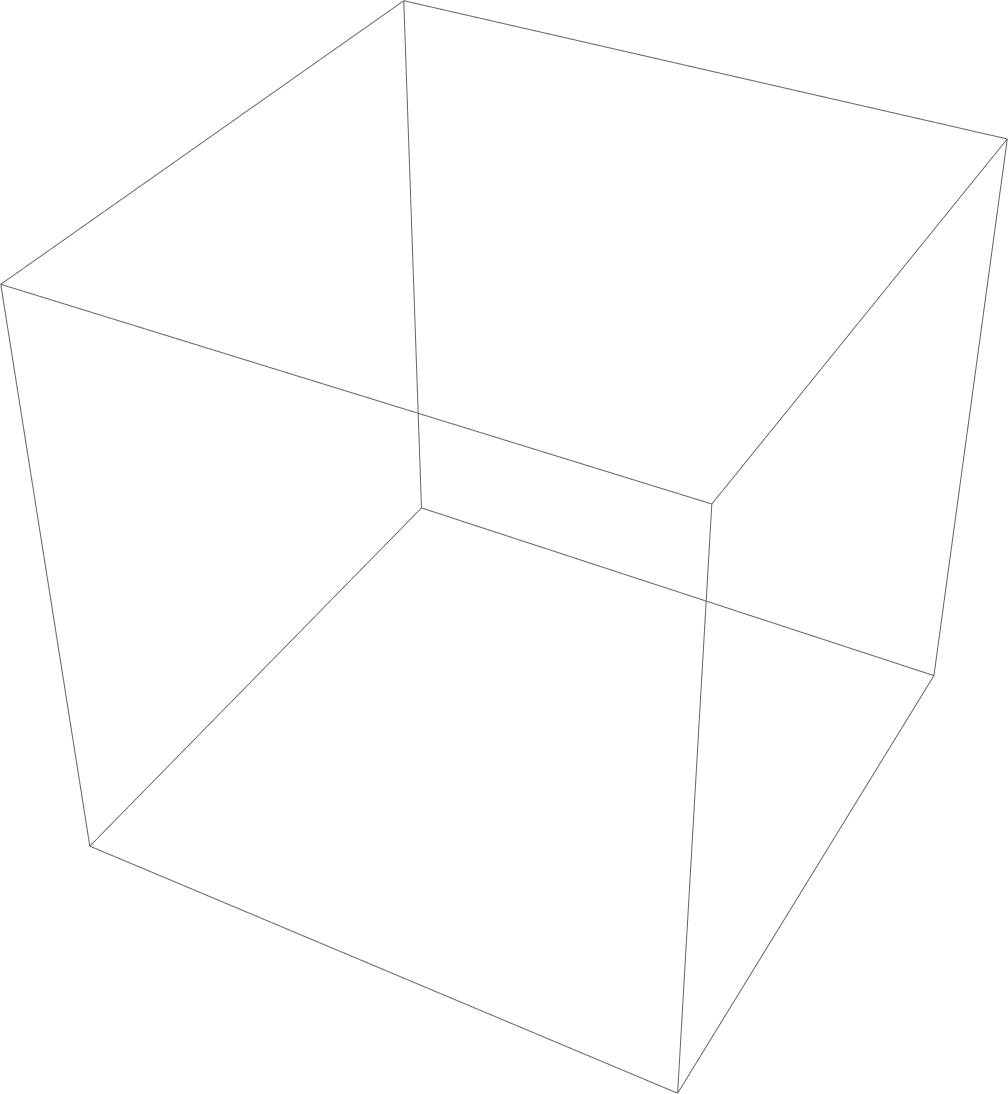
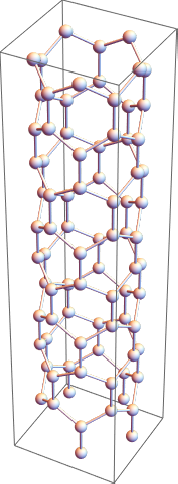
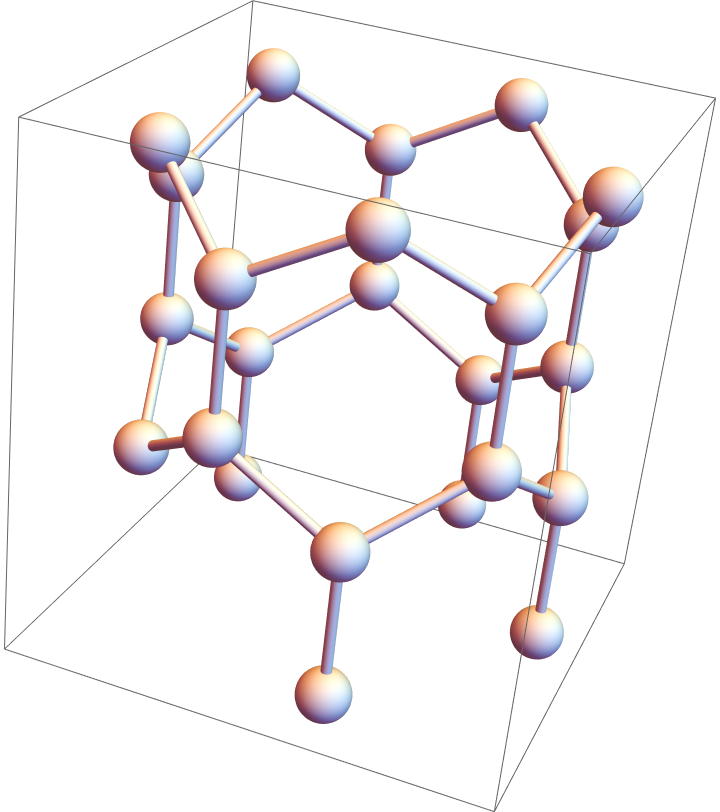
In[2]:=
Click for copyable input
Out[2]=
In[3]:=
Click for copyable input
In[4]:=
Click for copyable input
Out[4]=

GTPlotCluster

In[1]:=
Click for copyable input

Generate the cluster.

In[2]:=
Click for copyable input

Now the cluster can be plotted:
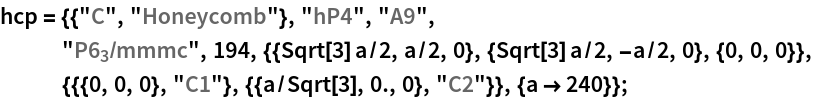
In[3]:=
Click for copyable input
Out[3]=
In[4]:=
Click for copyable input
Out[4]=
In[5]:=
Click for copyable input
Out[5]=

GTTubeStructure

Construct a honeycomb lattice:

In[1]:=
Click for copyable input
In[2]:=
Click for copyable input

A plot is the standard output.

In[3]:=
Click for copyable input
Out[3]=

It is also possible to choose a list as output. The first part of the list contains the positions of the atoms in the tube and the second part is the graphics object.

In[4]:=
Click for copyable input

Positions of the atoms:

In[5]:=
Click for copyable input
Out[5]//TableForm=

Plot the nanotube.

In[6]:=
Click for copyable input
Out[6]=