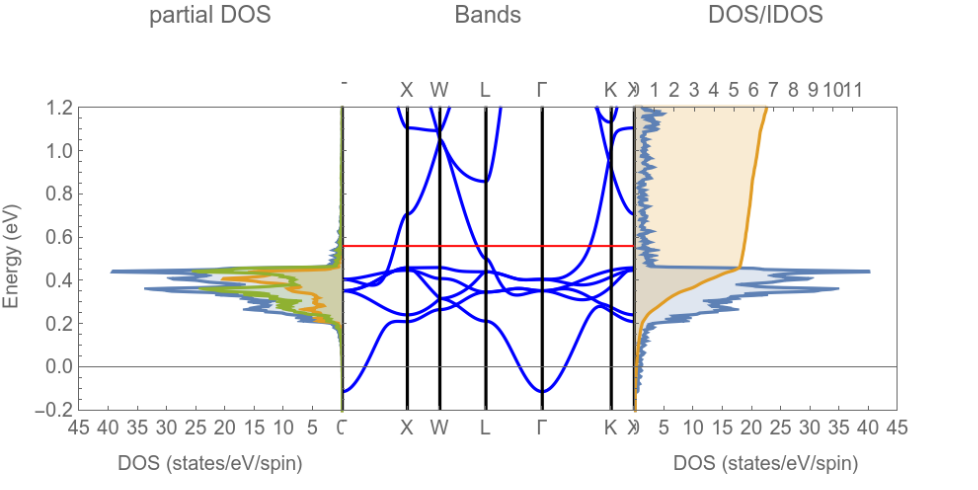
GTBandsDOSPlot

GTBandsDOSPlot[band structure,density of states, number of bands]
prepares a combined plot of a band structure and different representations of the density of states.

DetailsDetails

  • The band structure is calculated along symmetry lines in the Brillouin zone by means of GTBands. The density of states can be calculated by GTDensityOfStates or GTPartialDOS.
  • The command can be applied to band structures from tight-binding or plane wave electronic structure Hamiltonians, but can be used for photonic band structures as well. The representation of partial DOS is restricted to tight-binding Hamiltonians.
  • The parameter number of bands describes how much bands should be plotted from the band structure data set.
  • The following options can be given:
  • PlotRangeAllOption of ListPlot
    Filling5Option of ListPlot
    FrameLabel{{" ","Energy (eV)"},{"DOS (states/eV/spin)"," "}}Option of ListPlot
    PlotLabel{"Bands", "DOS / IDOS", "Partial DOS"}Option of ListPlot
    PlotStyleBlueOption of ListPlot
    GOFermiEnergy-100000Fermi energy for plot in band structure
    GOVerboseFalsecontrols output of additional information
    GOPlotDos"DOS"select style of plot
    GOPlotGrid{800, 400, 40}parameters for plotGrid
  • The command plotGrid is used for the combined figures. Author is "Jens". See Mathematica stack exchange https://mathematica.stackexchange.com/a/6882/53872
  • If GOPlotDos is set to "PDOS" or "ALL", FrameLabel, PlotLabel, and PlotStyle contain information to two plots, or three plots i.e. the definition deviates from the standard in ListPlot. Check examples below.
  • See: W. Hergert, M. Geilhufe, Group Theory in Solid State Physics and Photonics. Problem Solving with Mathematica
  • This is a new command introduced in version 1.2. A detailed description does not appear in the book.

ExamplesExamplesopen allclose all

Basic Examples  (5)Basic Examples  (5)

First load the package:

In[1]:=
Click for copyable input
In[2]:=
Click for copyable input

The band structure and DOS of Cu is used as an example. Read and parametrize the Hamiltonian.

In[3]:=
Click for copyable input

Choose the path in Brillouin zone and calculate the band structure.

In[4]:=
Click for copyable input
In[5]:=
Click for copyable input

Bands can be stored also to a file for later use.

In[6]:=
Click for copyable input

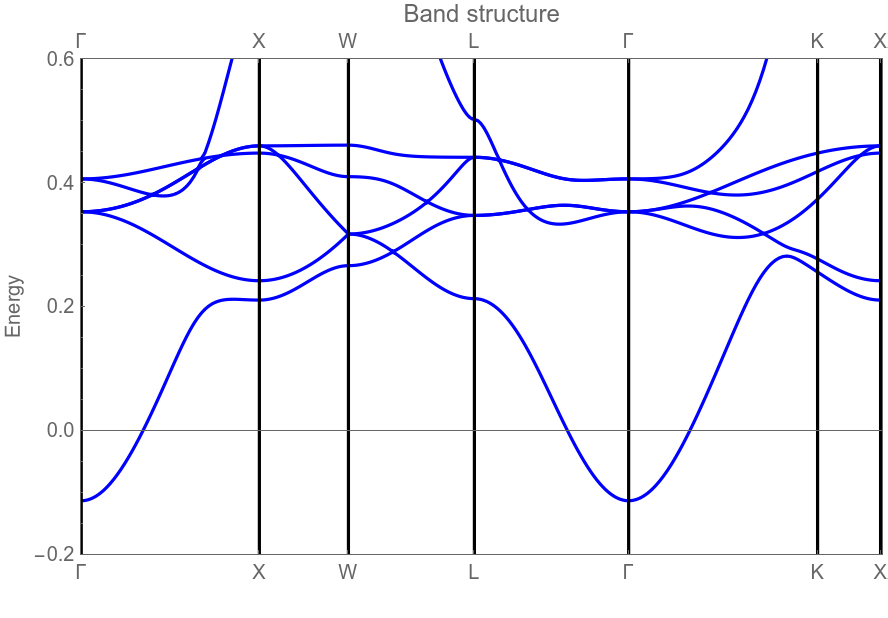
bands contains the information for a band structure plot and is used in GTBandsPlot.

In[7]:=
Click for copyable input
Out[7]=

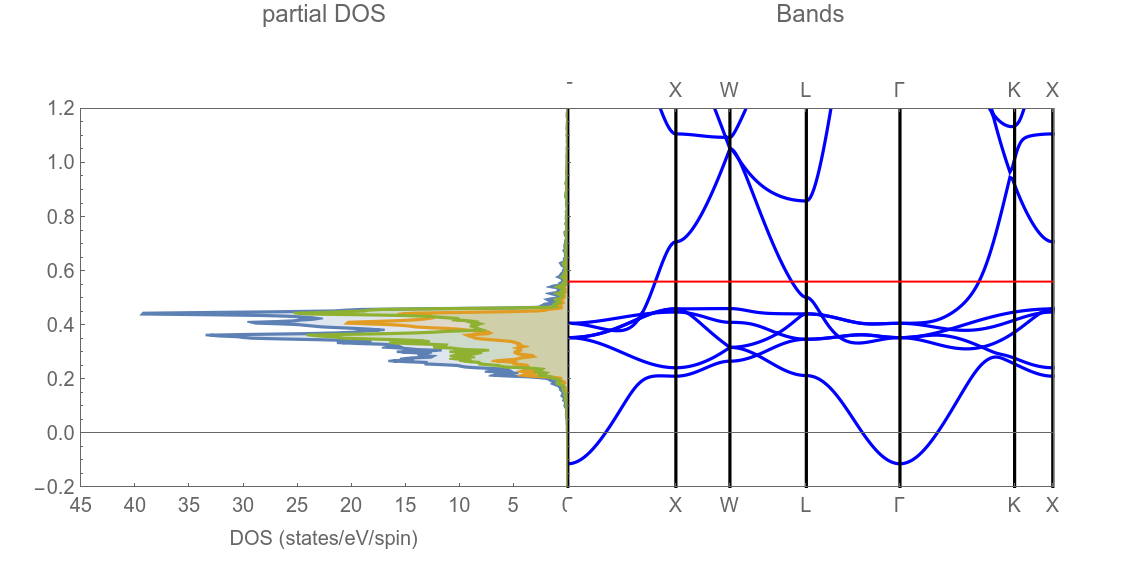
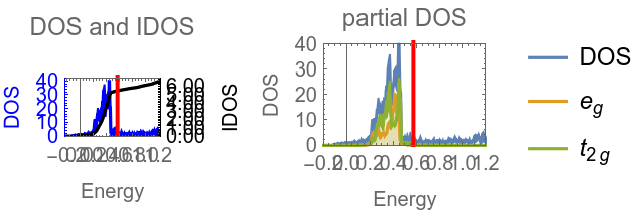
The DOS can be calculated using GTDensityOfStates or GTPartialDOS.

Partial DOS is calculated which contains a complete set of information

In[8]:=
Click for copyable input
In[9]:=
Click for copyable input
Out[9]=

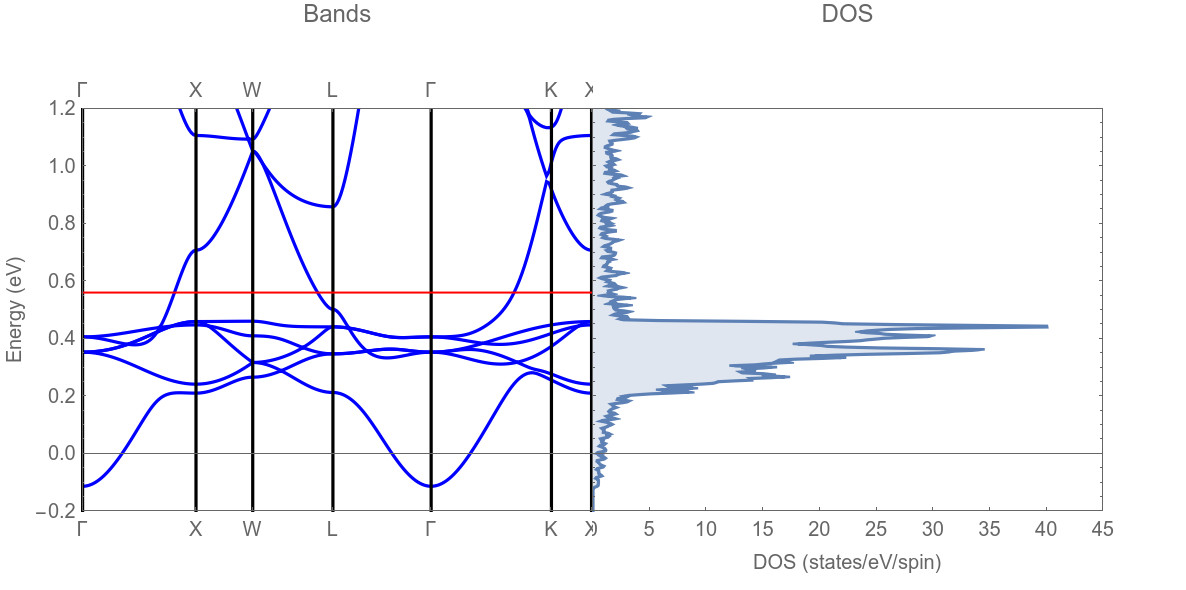
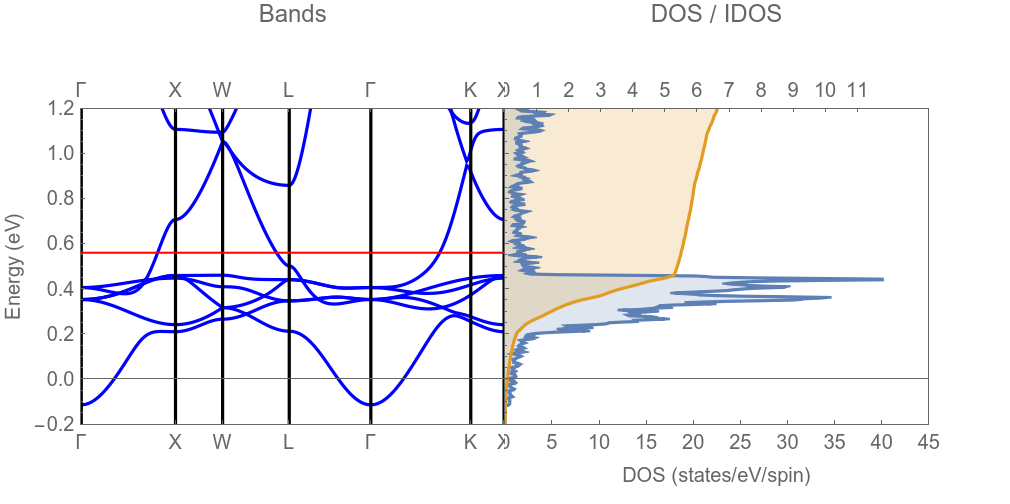
Combined plots are created. The band structure and DOS are taken from the files

In[10]:=
Click for copyable input
In[11]:=
Click for copyable input