GTFatBandsPlot

GTFatBandsPlot[bands,nband,scale]
plots nband fat bands from the data in bands. scale scales the thickness of the fat bands.

DetailsDetails

  • Bands have to be calculated in a first step by means of GTBands, GTFatBandsPlot is used afterwards for a graphical representation of the fat bands. In such a plot the orbital charcter in the band at a certain k-point is expressed by the thickness of the band.
  • Note, this works only for tight-binding Hamitonians with a well defined orbital characters.
  • The following options can be given:
  • FrameLabel{" ", "Energy"}labels to be placed on the edges of the frame
    GOFermiEnergy0Fermi Energy
    GOFatBands0Defines the fat bands for the plot
    JoinedFalsewhether to join points
    PlotLabel"Band structure"overall label of the plot
    PlotRangeAllrange of coordinates to include in plot
    PlotStyleBluestyle of the plot
  • See: W. Hergert, M. Geilhufe, Group Theory in Solid State Physics and Photonics. Problem Solving with Mathematica
  • This is a new command introduced in version 1.1. A detailed description does not appear in the book.

ExamplesExamplesopen allclose all

Basic Examples  (1)Basic Examples  (1)

First, load the package:

In[1]:=
Click for copyable input

As an example the band structure of Cu is calculated.

The corresponding data is loaded from an existing dataset. Furthermore, we generate a high-symmetry path for the fcc lattice using GTBZPath and the corresponding k-mesh using GTBZLines.

In[2]:=
Click for copyable input

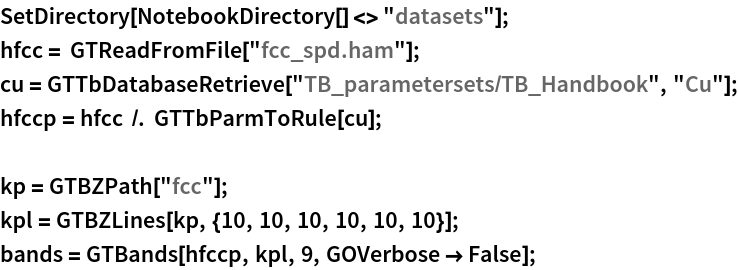
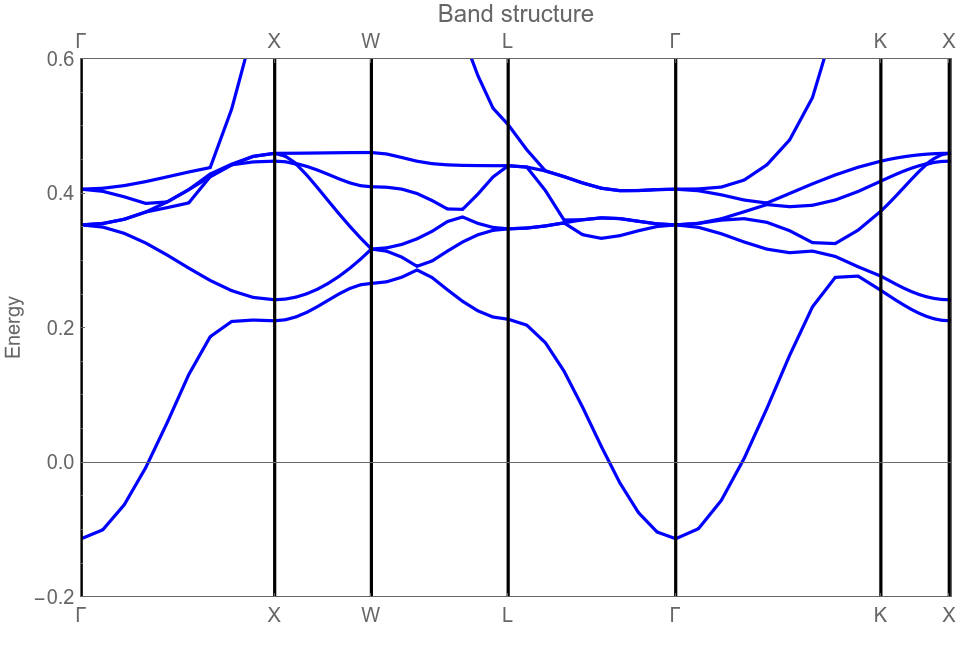
The list of bands is stored in the list bands and is used to plot the band structure with GTBandsPlot.

In[3]:=
Click for copyable input
Out[3]=

To calculate fat bands the corresponding eigenvectors are needed.

In[4]:=
Click for copyable input

To select the orbitals for the fat bands we show the form of the Hamiltonian.

In[5]:=
Click for copyable input
Out[5]=

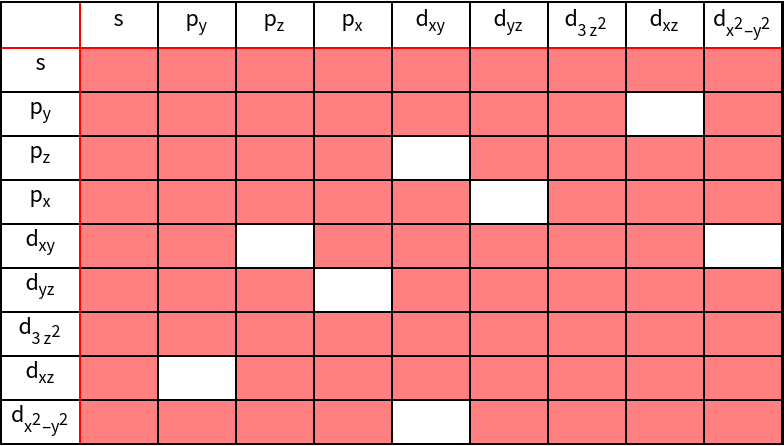
We conclude that the following indices belong to the orbitals: s - 1, p -{2,3,4}, d - {5,6,7,8,9},t2g -{5,6,8}, eg -{7,9}

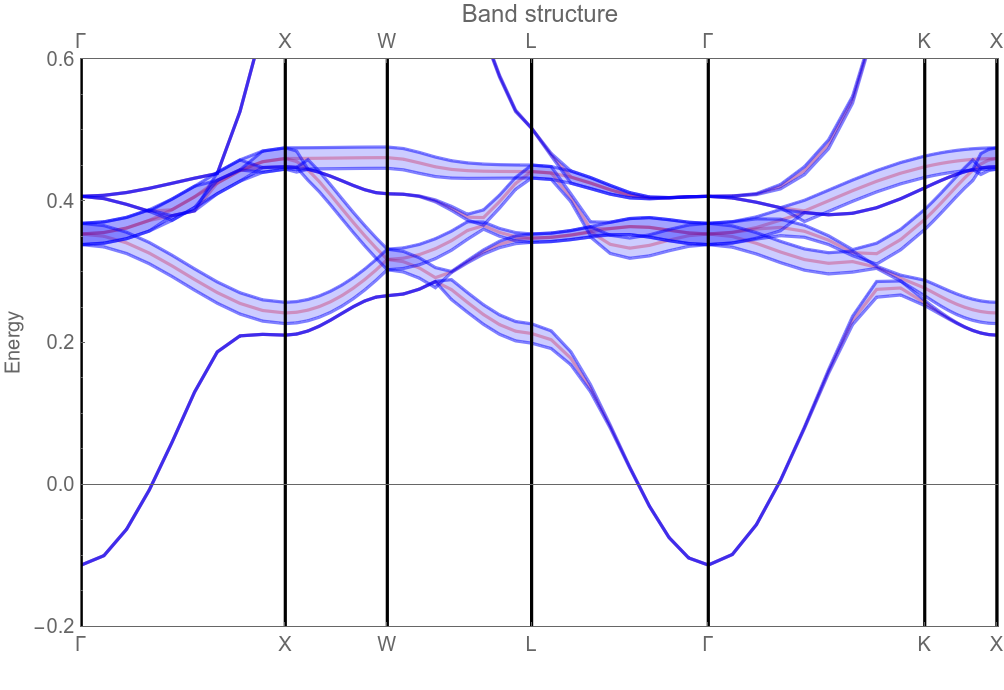
To highlight the d-character of the bands we use GTFatBandsPlot

In[6]:=
Click for copyable input
Out[6]=

t2g -character

In[7]:=
Click for copyable input
Out[7]=