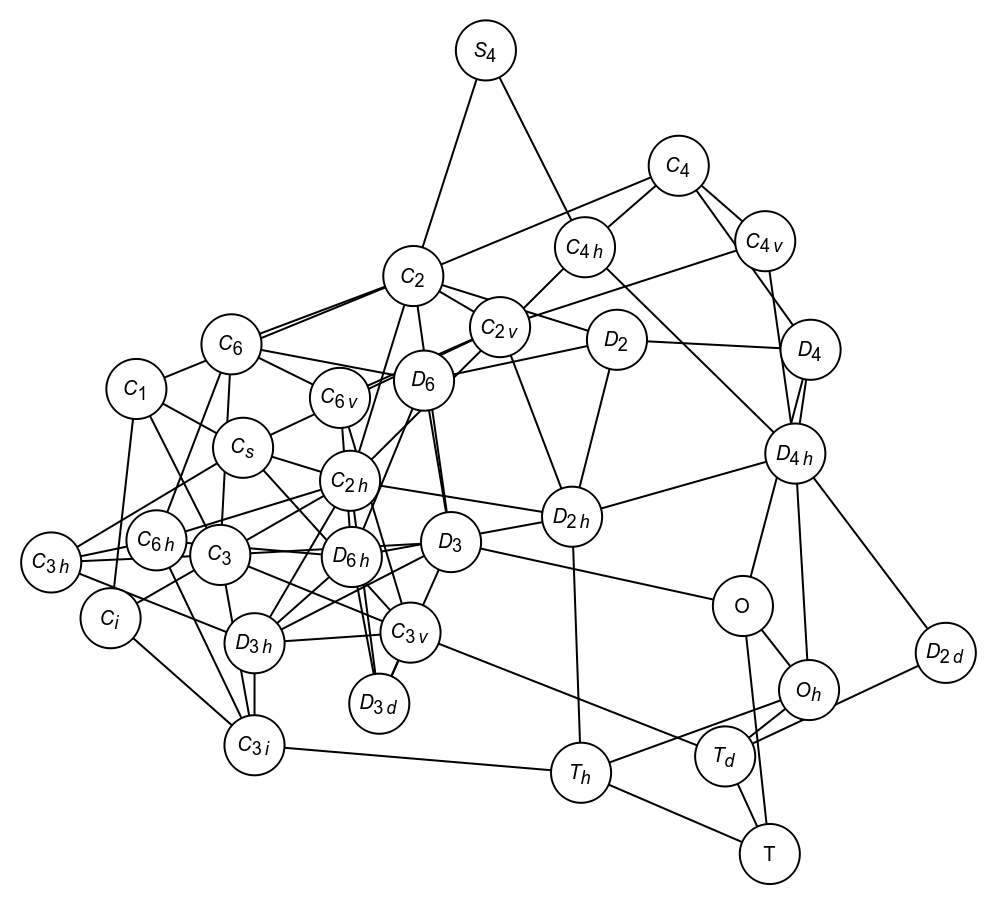
GTPointGroups

GTPointGroups[Mode]
gives a graph according to the subgroup relationships of the 32 point groups.

DetailsDetails

  • Mode = "Graph" gives a standard Graph representation.
    Mode = "LayeredGraph" tries to order the nodes of the graph.
    Mode = "Graph3D" shows a 3D plot of the graph.
  • The following options can be given:
  • GODimension3Selects 2D or 3D point groups
    GONotation"SFL"Changes the notation between SFL and HM
    GraphStyle"IndexLabeled"Option to Graph that specifies styles for graph elements
  • See: W. Hergert, M. Geilhufe, Group Theory in Solid State Physics and Photonics. Problem Solving with Mathematica, chapter 4.1.2.

ExamplesExamplesopen allclose all

Basic Examples  (3)Basic Examples  (3)

First, load the package:

In[1]:=
Click for copyable input

Then run the examples:

In[2]:=
Click for copyable input
Out[2]=
In[1]:=
Click for copyable input
Out[1]=
In[1]:=
Click for copyable input
Out[1]=