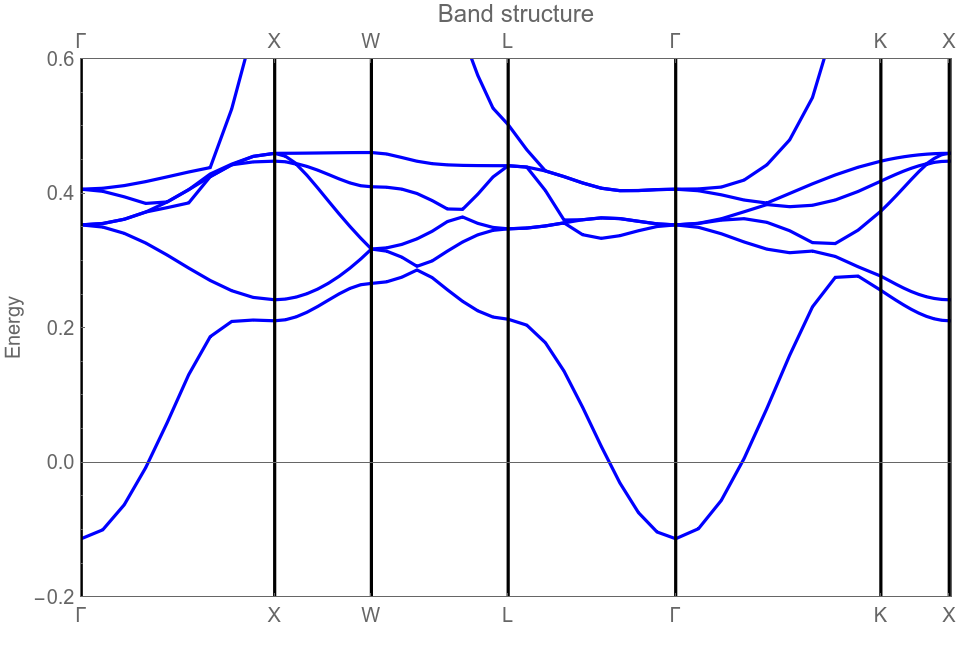
GTBandsPlot

GTBandsPlot[file,nband]
plots nband bands from the data in file.

DetailsDetails

  • Bands can be calculated in a first step by means of GTBands, GTBandsPlot is used afterwards for a graphical representation.
  • The following options can be given:
  • FrameLabel{" ", "Energy"}labels to be placed on the edges of the frame
    GOFermiEnergy0Fermi Energy
    GOShift0Shifts the energies by a fixed value
    JoinedFalsewhether to join points
    PlotLabel"Band structure"overall label of the plot
    PlotRangeAllrange of coordinates to include in plot
    PlotStyleRGBColor[0, 0, 1]style of the plot
  • See: W. Hergert, M. Geilhufe, Group Theory in Solid State Physics and Photonics. Problem Solving with Mathematica, chapter 9.7.2

ExamplesExamplesopen allclose all

Basic Examples  (1)Basic Examples  (1)

First, load the package:

In[1]:=
Click for copyable input

Then prepare the data:

In[2]:=
Click for copyable input

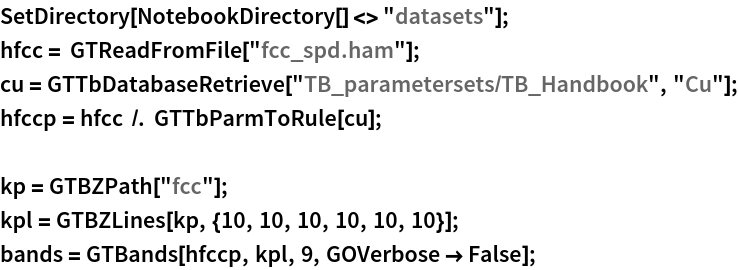
The list of bands is stored in the list bands and is used to plot the band structure with GTBandsPlot.

In[3]:=
Click for copyable input
Out[3]=