GTBands

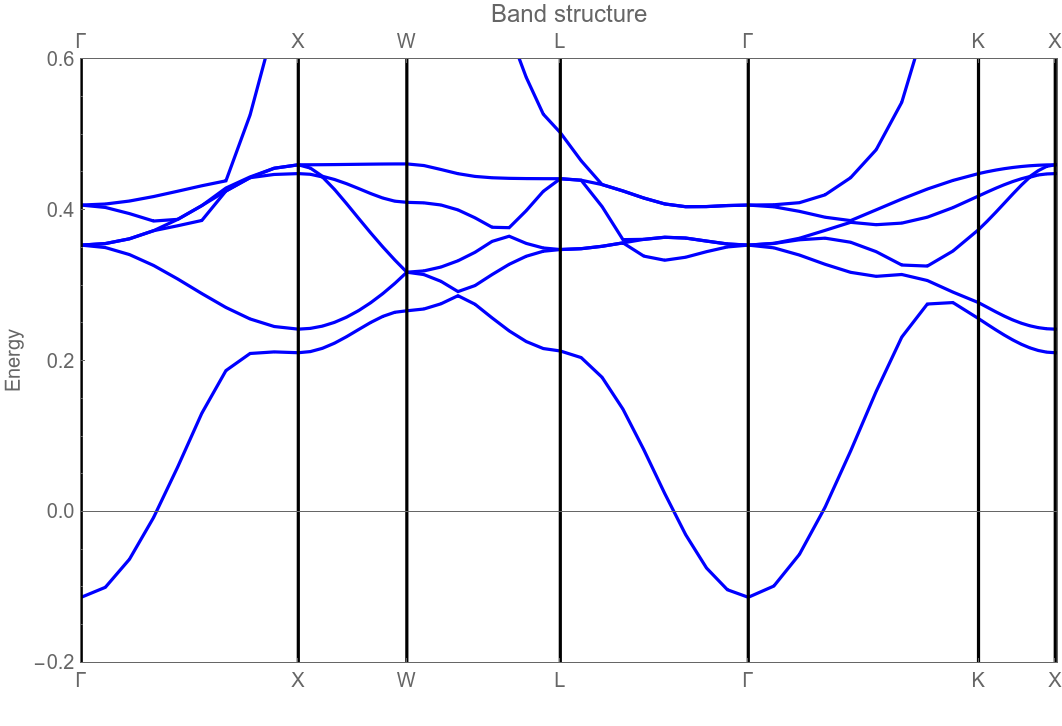
GTBands[Hamiltionian,kpoints,nev]
calculates the lowest nev band energies for a given Hamiltonian at certain kpoints.

DetailsDetails

  • The Hamiltonian represents a matrix eigenvalue problem resulting from tight-binding or plane wave theory in electronic structure problems or as a result of the master equation in photonics. Also phonon can be considered.
  • GTBands is used to decouple the calculation of the band structure from the plot. This is useful if large matrices have to be diagonalized as it is usually the case for photonic problems.
  • The band structure can be calculated along paths in the Brillouin zone, i.e. data for a band structure plot are generated. On the other hand the eigenvalues on a mesh in the irreducible part of the Brillouin zone can be calculated as a first step to calculate the density of states.
  • The following options can be given:
  • GODecimals4Controls the number of fractional digits in tables
    GOEigenvectorsFalseControls whether the eigenvectors will be calculated.
    GOPhotonicFalseDistinguishes between photonic and electronic bandstructure calculation.
    GOPlotBandsTrueControls calculation of energy bands in the Brillouin zone.
    GOShift0Shift the energies by a fixed value.
    GOStore0Controls output of bands and eigenvalues to files.
    GOTbOrthogonalTrueControls if the calculation is a standard or general eigenvalue problem.
    GOVerboseFalseControls the output of additional information.
  • See

    Possible IssuesPossible Issues

    for a small change in version 1.2.
  • See: W. Hergert, M. Geilhufe, Group Theory in Solid State Physics and Photonics. Problem Solving with Mathematica, chapter 9.6.

ExamplesExamplesopen allclose all

Basic Examples  (1)Basic Examples  (1)

First load the package :

In[1]:=
Click for copyable input

The Hamiltonian will be prepared.

In[2]:=
Click for copyable input

A list of k-points will be prepared.

In[3]:=
Click for copyable input

The bands are calculated along the path.

In[4]:=
Click for copyable input

This result can be used immediately to plot the band structure of Cu.

In[5]:=
Click for copyable input
Out[5]=