GTDensityOfStatesPlot

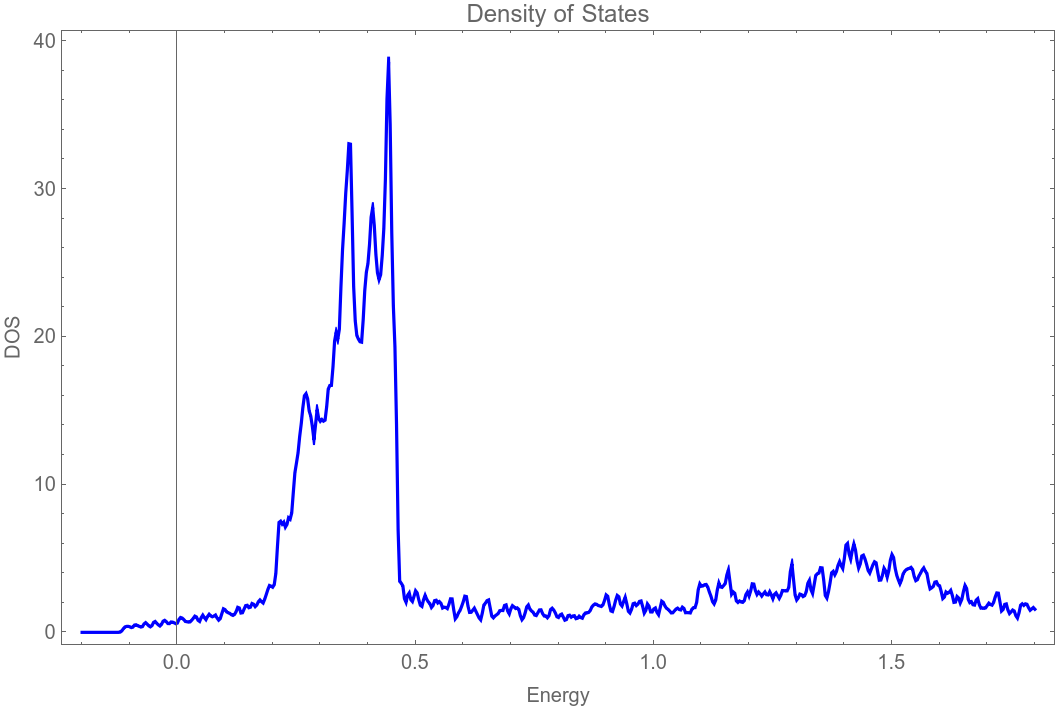
GTDensityOfStatesPlot[band structure,parameters]
calculates the density of states from a precalculated band structure.

DetailsDetails

  • The band structure is calculated on a mesh of the Brillouin zone by means of GTBands.
  • The vector parameters contains data for the DOS calculation.
  • parameters = {emin, emax, ne, σ, scale}
  • [emin,emax]energy intervall for DOS calculation
    nenumber of energy points to calculate the DOS
    σwidth of the Gaussians (if σ = 0 the energy step width is used)
    scaleThe whole DOS can be scaled by the factor scale. This is sometimes helpful for comparisons.
  • The following options can be given:
  • FrameLabel{"Energy", "DOS"}
  • Option of ListPlot
  • GOBands"All"Selects the bands to be included in the DOS calculation
    GOFermiEnergy0Calculates the Fermi energy
    GOPlotDos"DOS"Plots density of states or integrated DOS or both
    GOStore0Stores the DOS, if a file name is given
    PlotLabel"Density of states"
  • Option of ListPlot
  • PlotRangeAllOption of ListPlot
    PlotStyleRGBColor[0, 0, 1]Option of ListPlot
  • See: W. Hergert, M. Geilhufe, Group Theory in Solid State Physics and Photonics. Problem Solving with Mathematica, chapter 9.7.2.

ExamplesExamplesopen allclose all

Basic Examples  (1)Basic Examples  (1)

First load the package:

In[1]:=
Click for copyable input
In[2]:=
Click for copyable input

The DOS of Cu is used as an example. Read and parametrize the Hamiltonian.

In[3]:=
Click for copyable input

Calculate the k-points in the irreducible wedge.

In[4]:=
Click for copyable input

Calculate and store the bands.

In[5]:=
Click for copyable input
In[6]:=
Click for copyable input

Read the bands from file and calculate the DOS.

In[7]:=
Click for copyable input
In[8]:=
Click for copyable input
In[9]:=
Click for copyable input
Out[9]=