GTPlotStructure

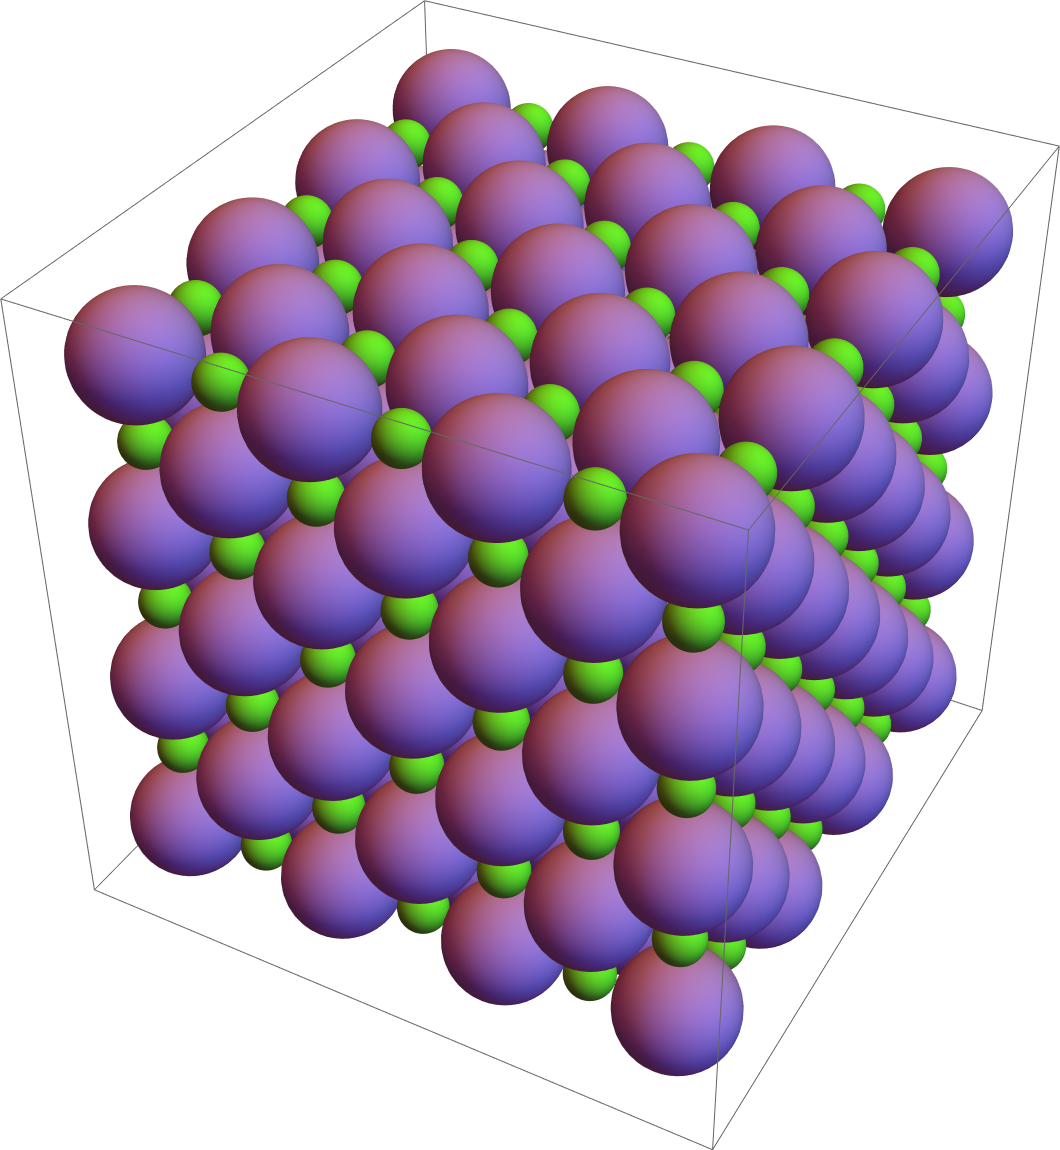
GTPlotStructure[structure,Min,Max,scale]
plots a crystal structure within a certain plot range, defined by Min and Max. scale is an overall scaling factor for the radii of atoms.

DetailsDetails

  • GTPlotStructure uses the atomic radius as well as a certain color from ElementData.
  • For a 3-dimensional crystal structure, 3 linear independent basis vectors exist. The vectors Min and Max specify the plot range in numbers of repreated units in each of the 3 directions.
  • Scale scales the radii of all atoms.
  • GTPlotStructure gives a first impression of the investigated structure. For more advanced graphics use Vesta or XCrysden. GTExportXSF allows the output of structural data for use in XCrysden.
  • See: W. Hergert, M. Geilhufe, Group Theory in Solid State Physics and Photonics. Problem Solving with Mathematica

ExamplesExamplesopen allclose all

Basic Examples  (1)Basic Examples  (1)

First, load the package:

In[1]:=
Click for copyable input

Then run the example:

In[2]:=
Click for copyable input
In[3]:=
Click for copyable input
In[4]:=
Click for copyable input
Out[4]=
In[5]:=
Click for copyable input
Out[5]=